Aerial photography provides a unique insight into the landscape around us. Creating abstract aerial photography plays with our understanding of the visual environment.
Here are 7 tips for creating abstract aerial landscape photography.
7. Paintings as Inspiration for Aerial Landscape Photography
Much like abstract photography, abstract painters strive to convey an atmosphere or an emotion without referencing the objective.
Exploring landscape and abstract painting informs your approach to aerial abstract landscape photography. It will help you identify artistic potential and curate well-thought out compositions.
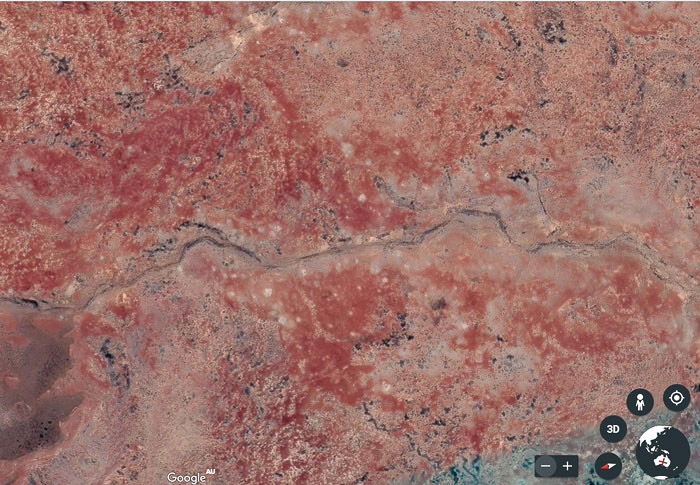
6. Use Google Earth to Research Aerial Photography Locations
Google Earth inspires exploration. It offers you a top-down rendering of the Earth from a satellites’ point of view. This allows you to locate potential sites and gain some inspiration for your next aerial shoot.
Simply click on an area in the globe and zoom in to inspect the landscape from above. Just keep in mind that factors like the season and weather can change the landscape.
What you see in Google Earth won’t always be what you see through the viewfinder on the day.
Regardless, Google Earth is a great tool for inspiring your next aerial shoot.
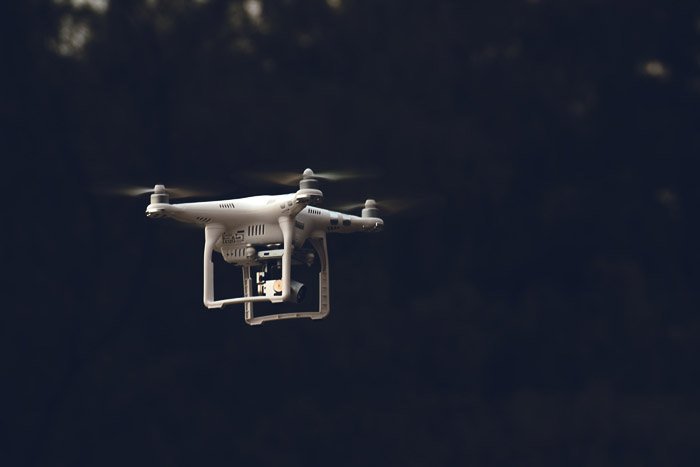
5. Use Drones for Abstract Aerial Photography
One of the biggest advantages of drone-based aerial photography is flexibility. Inside a manned aircraft, the capacity to take photos is limited by the capabilities of the aircraft.
Fixed-wing and even rotary-wing aircraft have pronounced turning circles. The size of an average camera-equipped drone allows for quick and easy adjustments in perspective.
Diving in With Drones
The best drone photography often features places that are difficult or impossible to access with fixed and rotary-winged aircraft.
Flying close to uneven ground or just above the tree line may prove too risky for manned aircraft. It’s a lot safer with the smaller, more agile drone.
You can make dynamic images of your surroundings without ever leaving the ground yourself.
Additionally, drones (and helicopters) can operate without a dedicated runway.
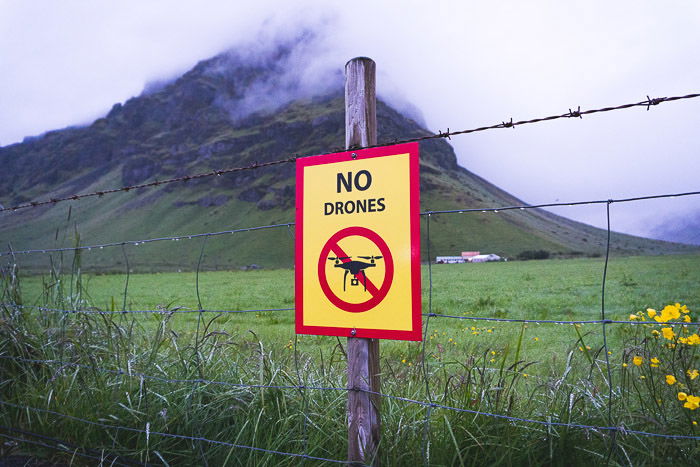
Before taking to the skies, familiarise yourself with your country’s civil aviation safety authority’s rules and regulations.
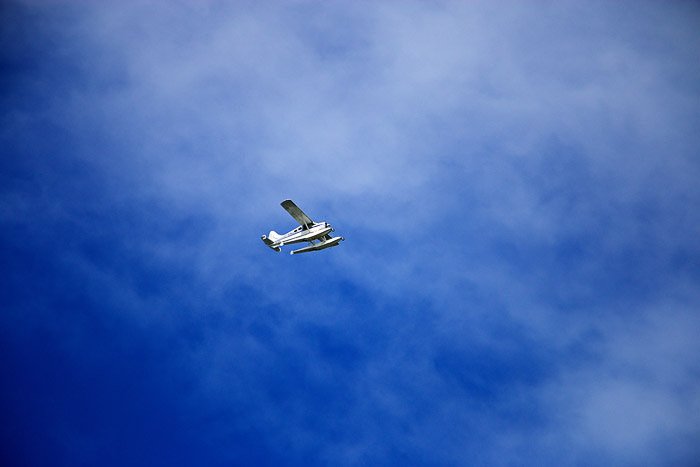
4. Photograph From a Fixed-Wing Aircraft
This is more expensive than a drone. But manned fixed-wing aircraft are cheaper to charter then helicopters. Plus, the fixed-wing aircraft has a much-increased payload.
You aren’t limited to matching the capabilities of a smaller drone. There are attachments that can mount a full DSLR to a suitably equipped drone. But the outlay makes remote-control flying just a little riskier.
Flying Fixed
The range and endurance of fixed-wing aircraft is superior to the drone. The latter relies on a battery of limited capacity.
Being able to fly faster and longer in a fixed-wing aircraft means that you have hours of flight-time to photograph abstract aerial landscapes. All without having to recharge several times in between.
Fixed-wing aircraft also have greater reach in terms of altitude than the average drone. This gives you the option of capturing scenery at a greater distance from the earth.
A Vision for Visibility
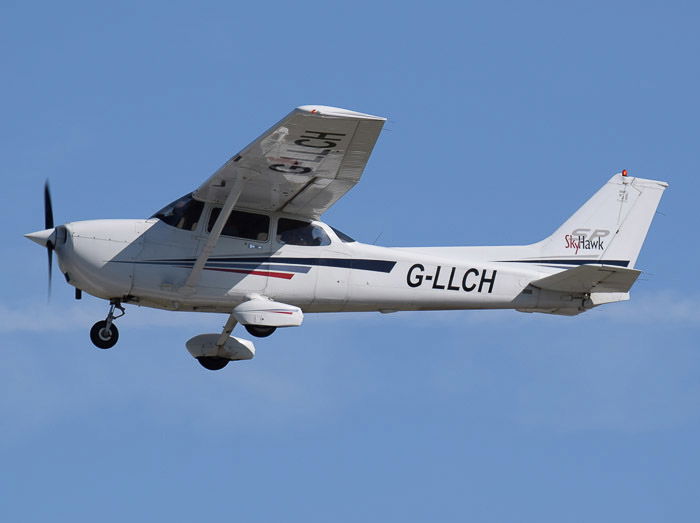
It may seem obvious, but a high-wing aircraft is a must for abstract aerial landscape photography.
A low wing configuration will almost completely obscure your vision of the landscape below.
Many fixed-wing aircraft have an openable window in the front passenger seat to photograph through. If not, you’ll need to shoot through the Plexiglass window to capture the scene below.
Use a lens skirt if you have one, and wear dark clothing to keep reflections to a minimum. Plexiglass also tends to scratch and craze, leaving marks that will need cleaning up in Photoshop.
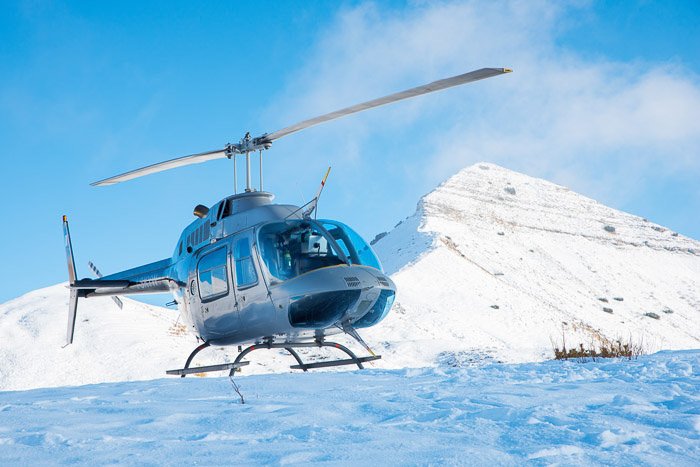
3. Take Abstract Aerial Landscapes From Helicopters
When it comes to flexibility in the sky, helicopters and drones excel over fixed-wing configurations.
Helicopters have the capacity to hover or travel at a much-reduced airspeed. They can hone right in on a subject, which means less time lining up a shot and more time shooting.
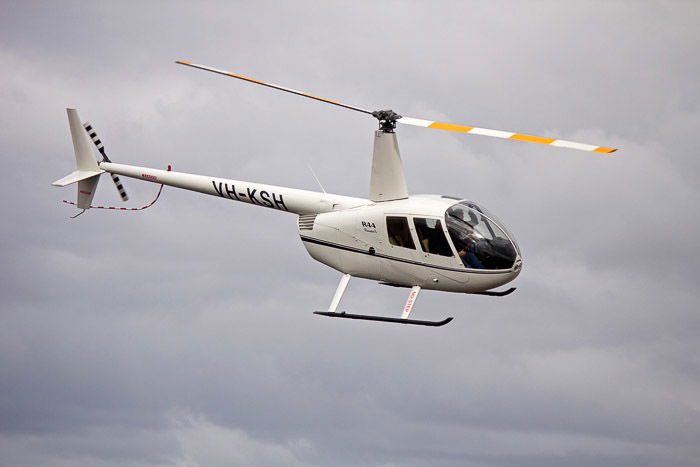
Removable or sliding doors are much more prevalent in helicopters than in fixed-wing aircraft. Arranging for a doorless-capable helicopter delivers an unhampered view of the landscape below.
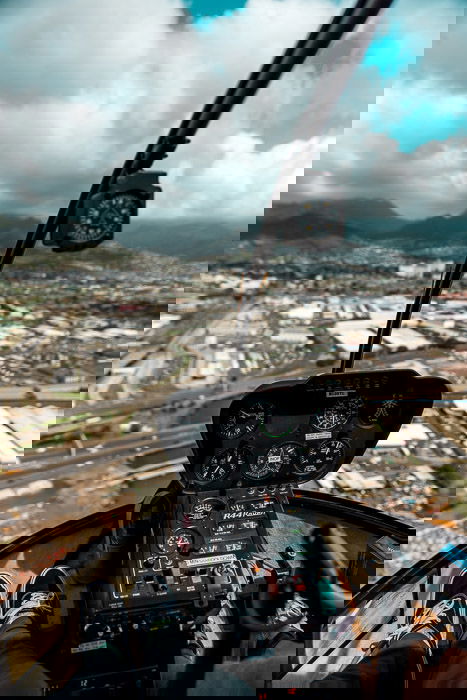
Bad Vibrations
Due to large and heavy rotating components, vibration is one difficulty photographers encounter when photographing aboard a helicopter.
Paying up
Perhaps the most significant downside of chartering a helicopter is the cost. You’ll have plenty of material after shooting for a couple of hours in a helicopter. But it’s easy to rack up some significant debt on the credit card.
Fixed-wing and drone photography are a more economical route.
2. Create Depth and Interest With Artistic Elements
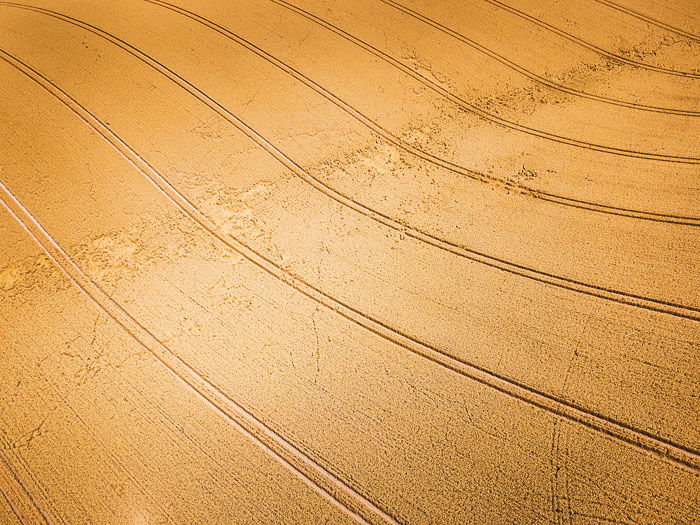
Lines
In landscape photography, a horizontal line suggests the horizon, dictating time and place. In abstract aerial landscape photography, a horizon isn’t necessary.
Instead, line regulates shape, form, rhythm and space, anchoring an image and creating depth.
Shape/Form
Put simply, shape is 2D. It’s an outline without any evidence of volume. Form refers to the point where a shape becomes 3D.
Shooting with the lens parallel to the landscape flattens a scene. It creates a study of the shapes that construct a plane of view.
Photographing a landscape at an angle cultivates form, illuminating the layers of a field of view.
Space
Space includes the background, foreground and middle ground of an image. It refers to the distance around, between and inside subject matter.
Negative space refers to the areas unoccupied by an object. An object itself is a positive space.
Balancing positive and negative space creates harmony.
For example, the presence of shadow within an abstract aerial landscape breaks up positive space, allowing a scene to breathe.
Value
Value defines the range of lightness to darkness in an image. Shooting during the golden or blue hour will produce more subtle values in tone, creating depth.
Photographing toward midday will cultivate a harsher value.
Make sure you plan the time of day for your flight to maximise the desired window of light.
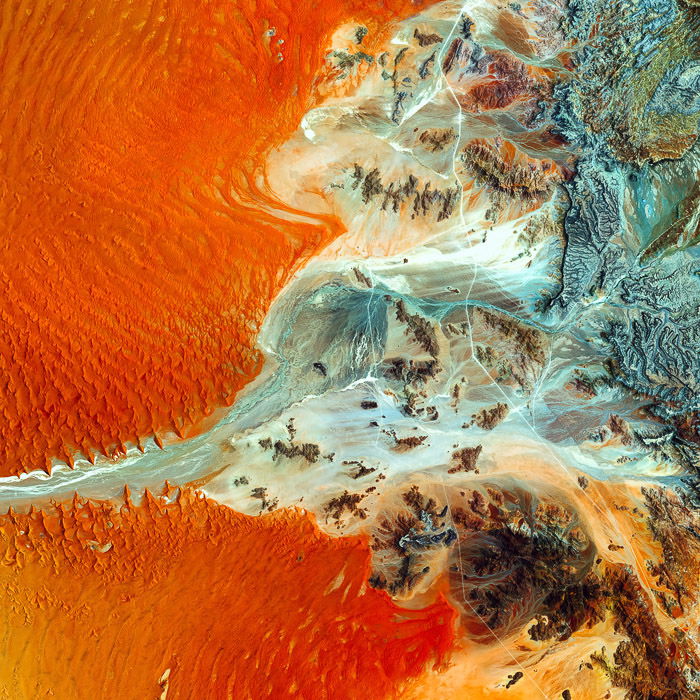
Color
Abstract aerial landscape photography captures colors that go unnoticed from the ground. Some landscapes are awash with color. Others are muted, creating a more subdued experience.
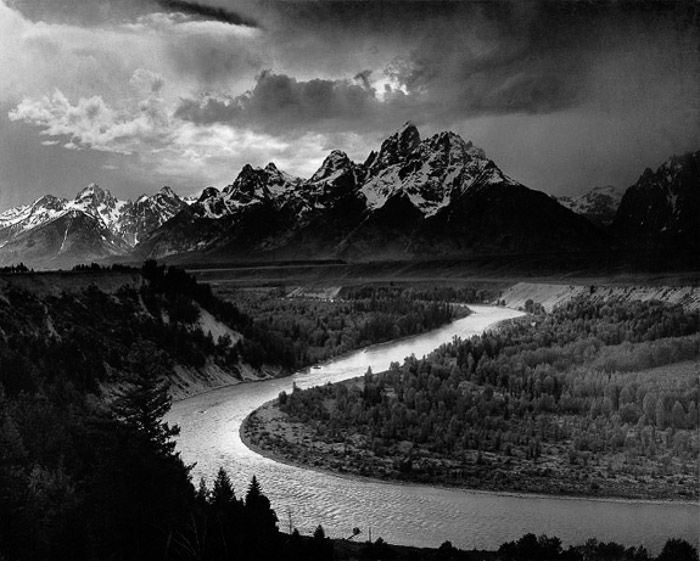
A monochrome or black and white scheme unifies an abstract aerial landscape, emphasizing form and tone.
Texture
Texture adds a sense of touch to a photograph. As one of the 5 senses, touch adds dimensionality to our world.
Abstract aerial landscape photography plays with our innate sense of touch. It makes an abstract landscape rich with tactility, yet with no solid visual reference.
This cultivates curiosity within a viewer, inviting them in for a closer look.
1. Use the Principles of Art and Design
Balance
Balance is the manifestation of weight in a composition. Symmetry and visual similarities between concepts or subject matter all create a sense of balance.
Asymmetry or opposing subject matter can disrupt the balance, creating a sense of unease or potentiality.
Balance can be instilled by the even distribution of an abstract aerial landscape and its features throughout a frame. Each part contributes to the sum of the image as a whole.
Imbalance occurs when a subject is visually ‘heavier’ than the rest of the image, de-emphasizing other elements of the composition to create emphasis or movement.
Rhythm
Subjects in a space dictate the way our eyes bounce from one point of interest to the next. This relationship between subjects delineates rhythm.
Subjects in proximity fast-track the viewing process. Subjects that are spaced out slow down the reading of an image, stimulating intrigue and reflection.
In abstract aerial landscape photography, a lack of objective subject matter generally engenders a slower rhythm. The inclusion of brighter colors, sharp angles or even abrupt camera movement can stimulate a faster rhythm.
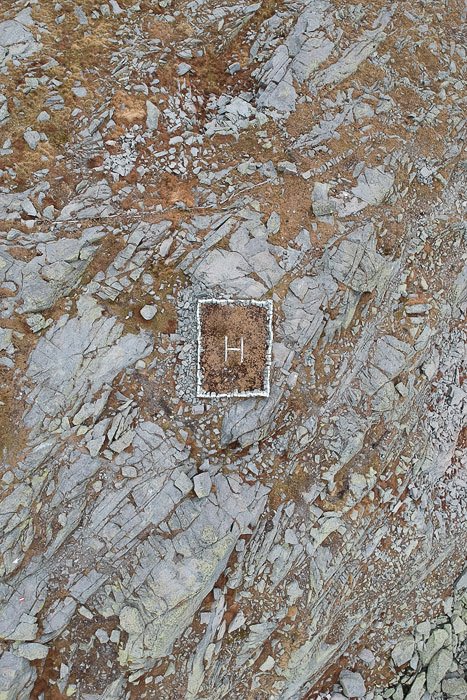
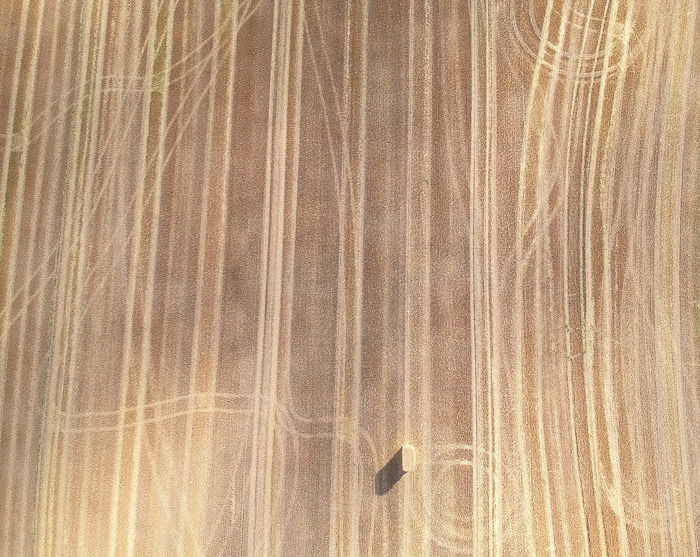
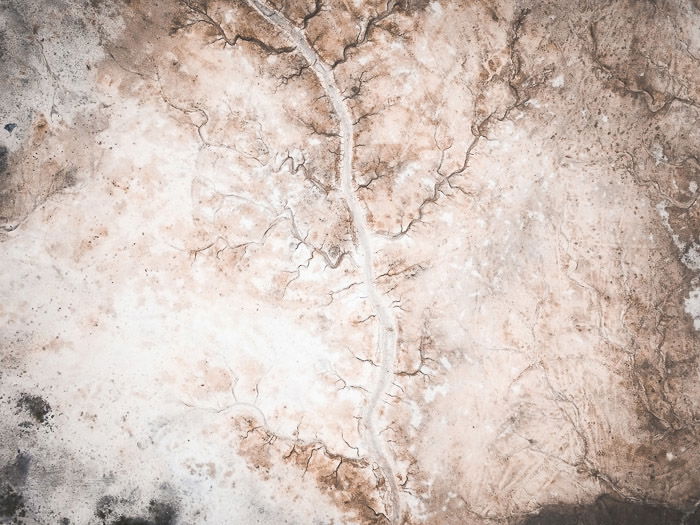
Pattern
The human eye is wired to seek out pattern. From urban sprawl to natural landscapes, pattern sorts the visual world into regulated posits of information.
In abstract aerial landscape photography, curating pattern requires a holistic approach. Cavernous lines etched into the earth become a pattern when viewed from above.
Emphasis
Tied to the focal point of an image, emphasis capitalizes on our response to certain visual stimuli over others.
The human eye is naturally attracted to highlights. By incorporating areas of bright color within an abstract aerial landscape, a photographer gives visual priority to particular points in an image over others.
Leading lines, texture and space are other tools that can be used to generate emphasis.
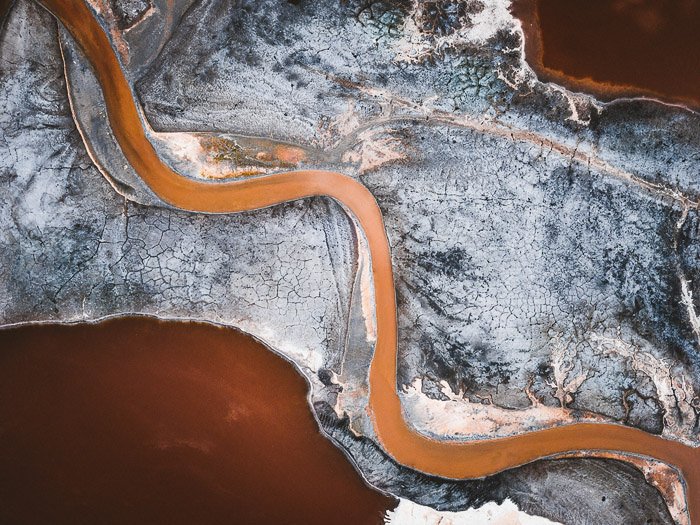
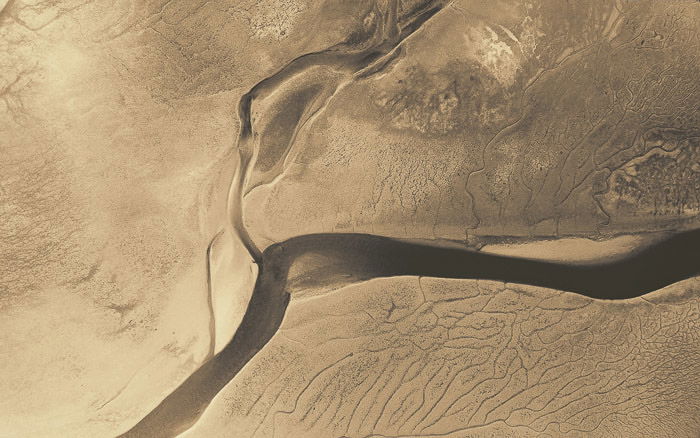
Contrast
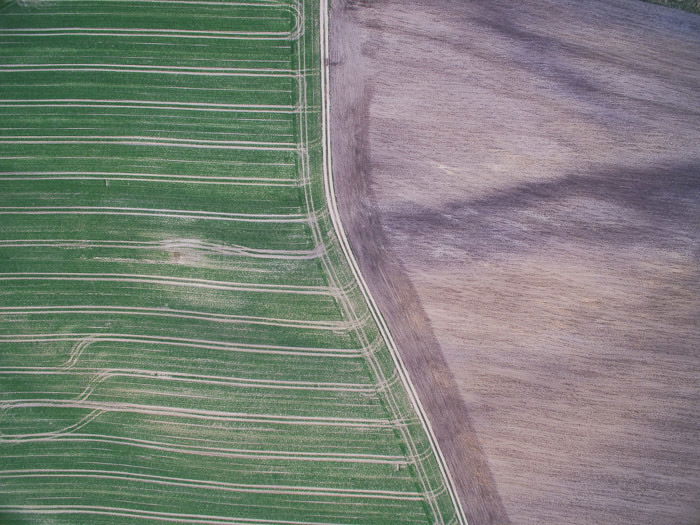
Rough against smooth, light against dark, contrasting subject matter garners energy and variation within an image.
Photographing the natural transition between the land and sea or capturing fields regulated by different colors are two examples of incorporating contrast into abstract aerial landscape photography.
Unity
Defined as a state or quality of being one, unity describes the visual relationship between the elements of art and design. In photography, unity cultivates elements that work together towards a common goal.
The act of photographing abstract aerial landscapes is unifying in concept. Incorporating repetition, alignment, proximity or contrast also creates a visually unified photograph.
Movement
Movement refers to the path a viewer’s eye takes through an image. By taking advantage of naturally occurring features in an abstract landscape (such as line and color), visual pathways are created within an abstract aerial landscape.
Conclusion
Abstract aerial landscape photography creates images that inspire and intrigue. An aerial photographer can depict the essence of an abstract landscape without relying on the objective subject matter.
Whether you decide to buy a drone or fly in a manned aircraft, capturing environments from above is a great way to depict a unique perspective of the world.
Happy flying!